

Kalamu ya Salaam's information blog
ECONOMICS: Income inequality in the United States

The Unequal States of America
Income trends have varied from state to state, and within states.
But a pattern is apparent: the growth of top 1% incomes.
Explore inequality in this interactive feature.
But a pattern is apparent: the growth of top 1% incomes.
Explore inequality in this interactive feature.
$1,153,293
Average annual income of the top 1%
$45,567
Average income of everyone else (the bottom 99%)
Average income of everyone else (the bottom 99%)
25.3x
The top 1% makes 25.3times more than the bottom 99%
The top 1% makes 25.3times more than the bottom 99%
What you need to make to be in the top 1%: $389,436
The top 1% takes home 20.1% of all the income
in the United States.
1% of the families


20.1% of the income


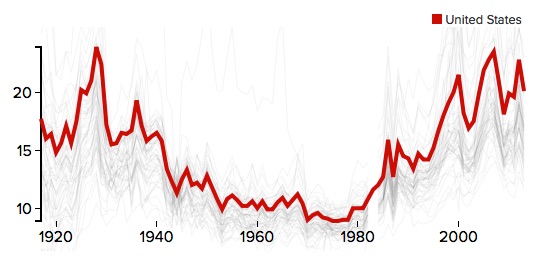
Share of income captured by the top 1%,
1917–2013
The share of all income held by the top 1% in recent years
has approached or surpassed historical highs.

1917–2013
The share of all income held by the top 1% in recent years
has approached or surpassed historical highs.
Inside the United States
Metropolitan areas
- Jackson, WY-ID is the most unequal metro area in the United States.
- The top 1% there makes 213.0 times more than the bottom 99%.
- Average income of the top 1% in Jackson, WY-ID is $19,995,834.
- The average income of the bottom 99% is $93,891.
Counties
- Teton County, Wyoming is the most unequal county in the United States.
- The top 1% there makes 233.0 times more than the bottom 99%.
- Average income of the top 1% in Teton County, Wyomingis $28,163,786.
- The average income of the bottom 99% is $120,884.
See inequality numbers for all counties [+] or metro areas [+]
>via: http://www.epi.org/multimedia/unequal-states-of-america/?utm_source=Economic+Policy+Institute&utm_campaign=a2d9b51854-EPI_News_06_17_20166_17_2016&utm_medium=email&utm_term=0_e7c5826c50-a2d9b51854-58178541


No comments:
Post a Comment